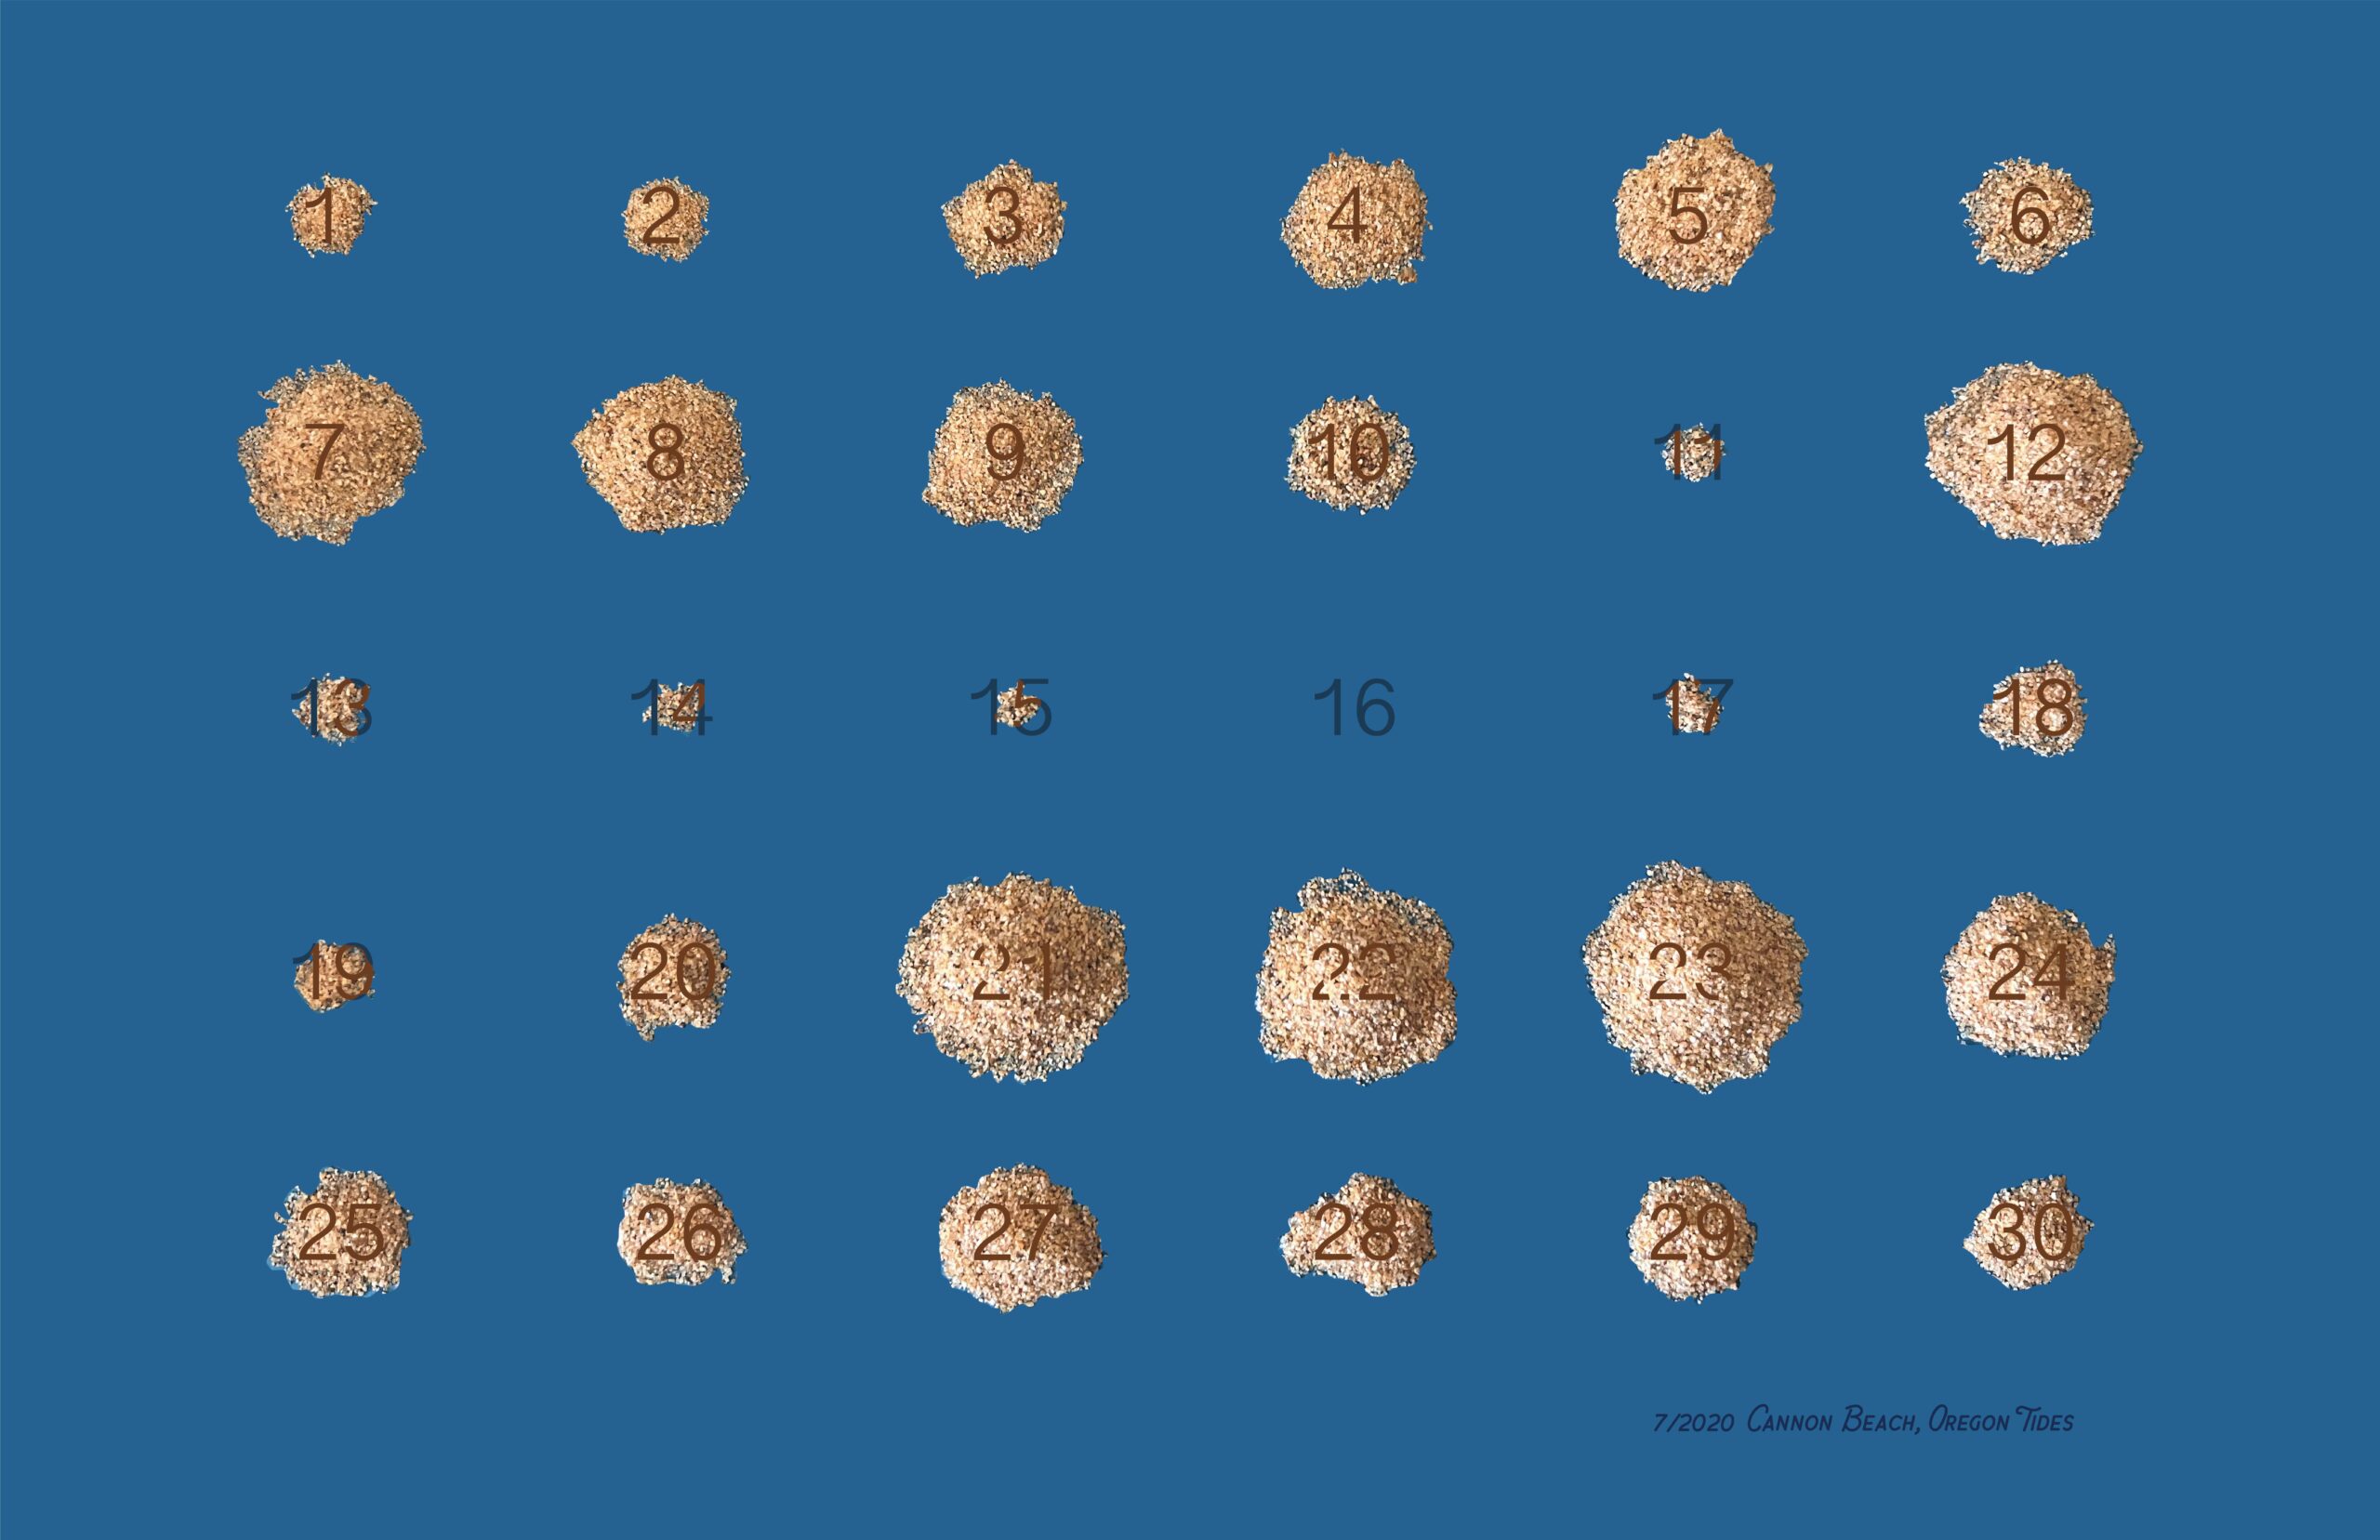
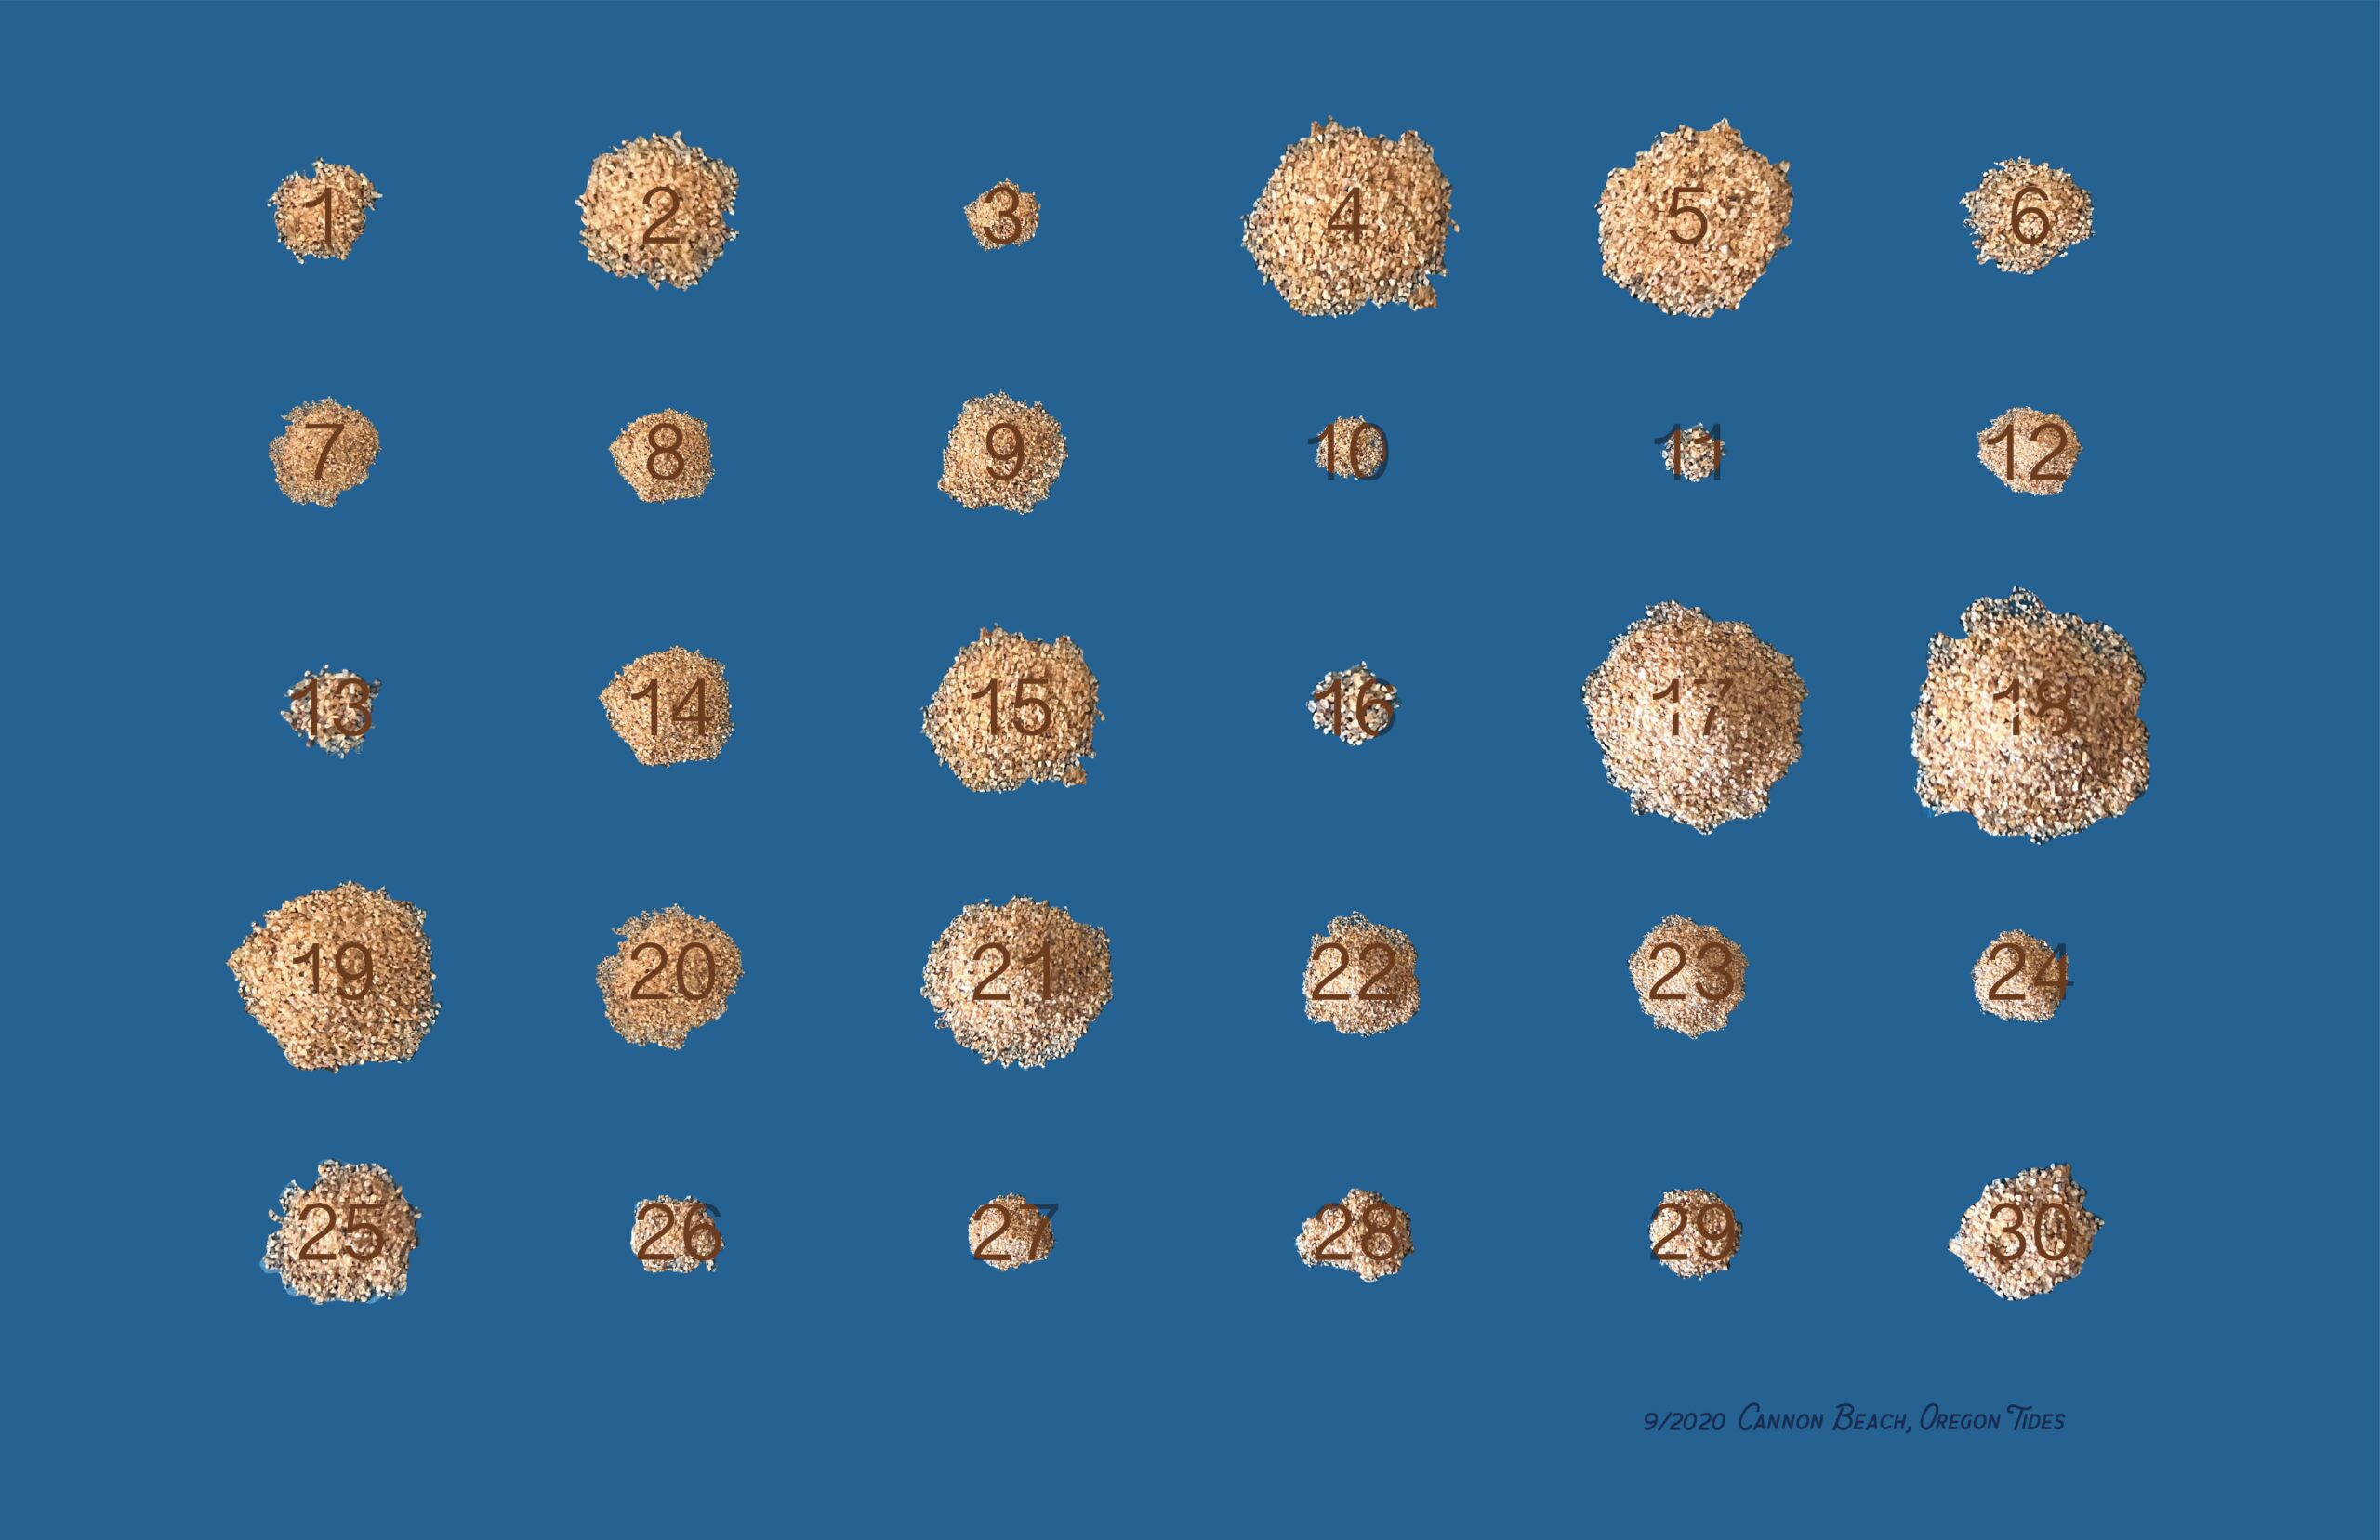
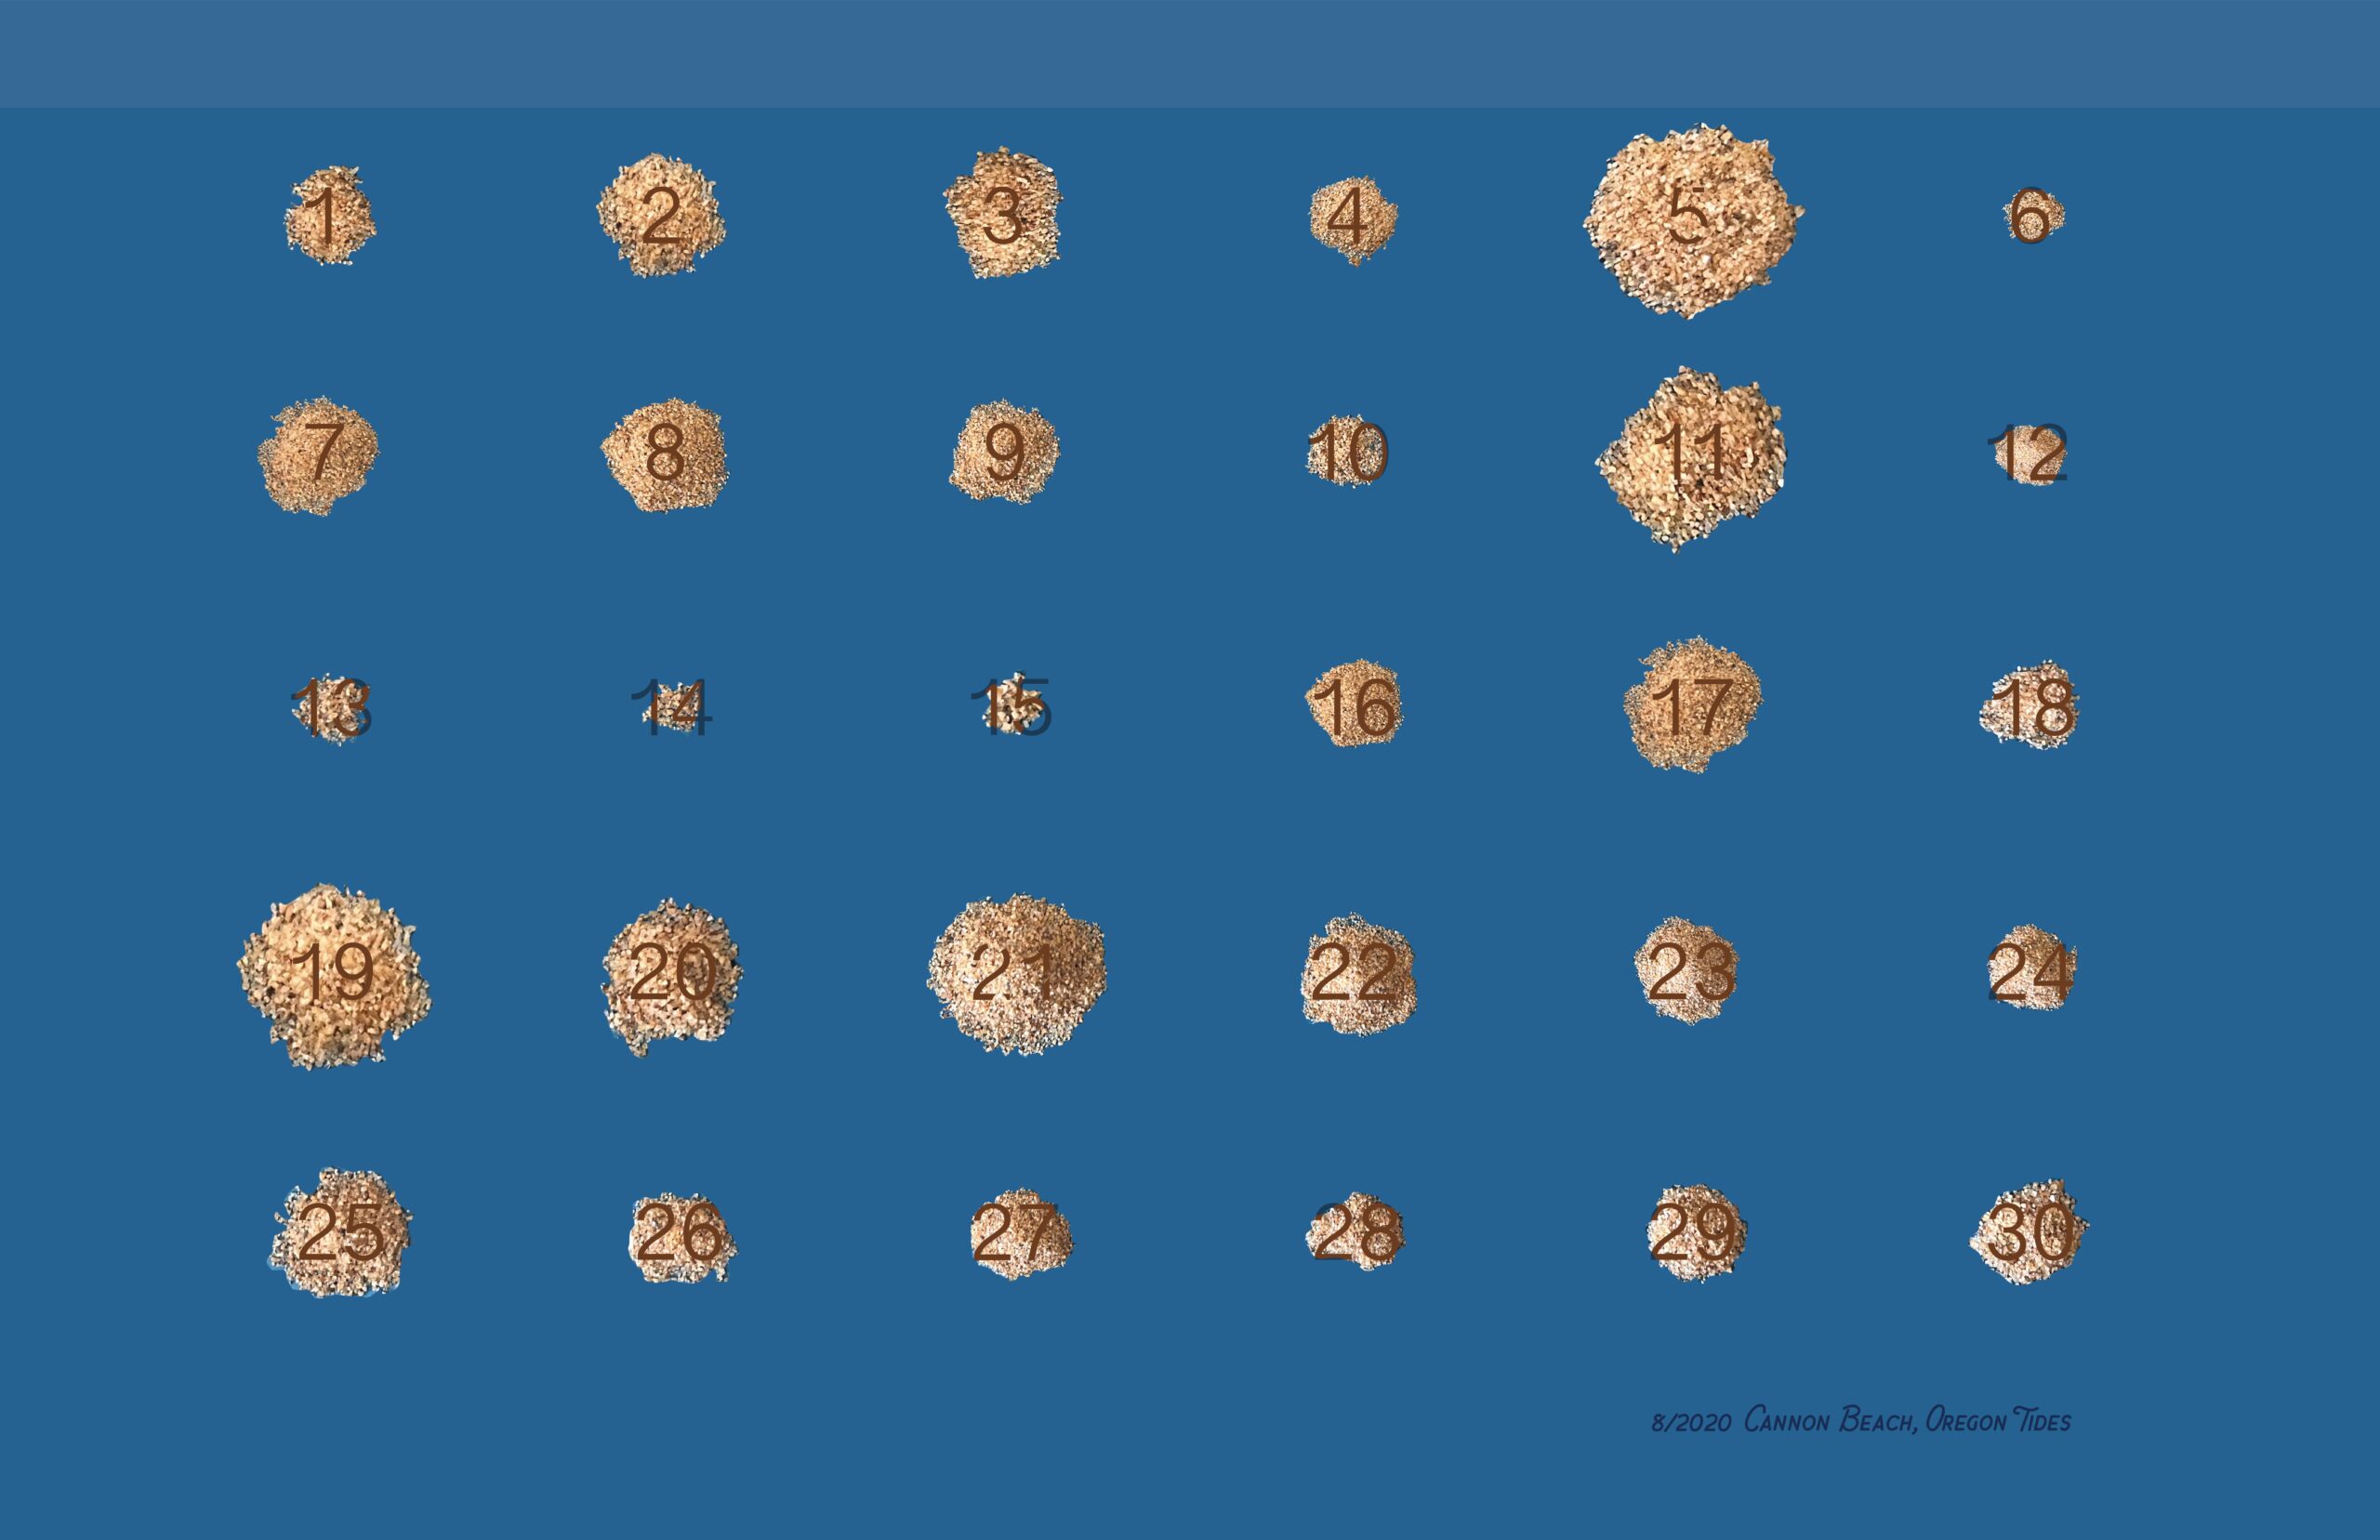
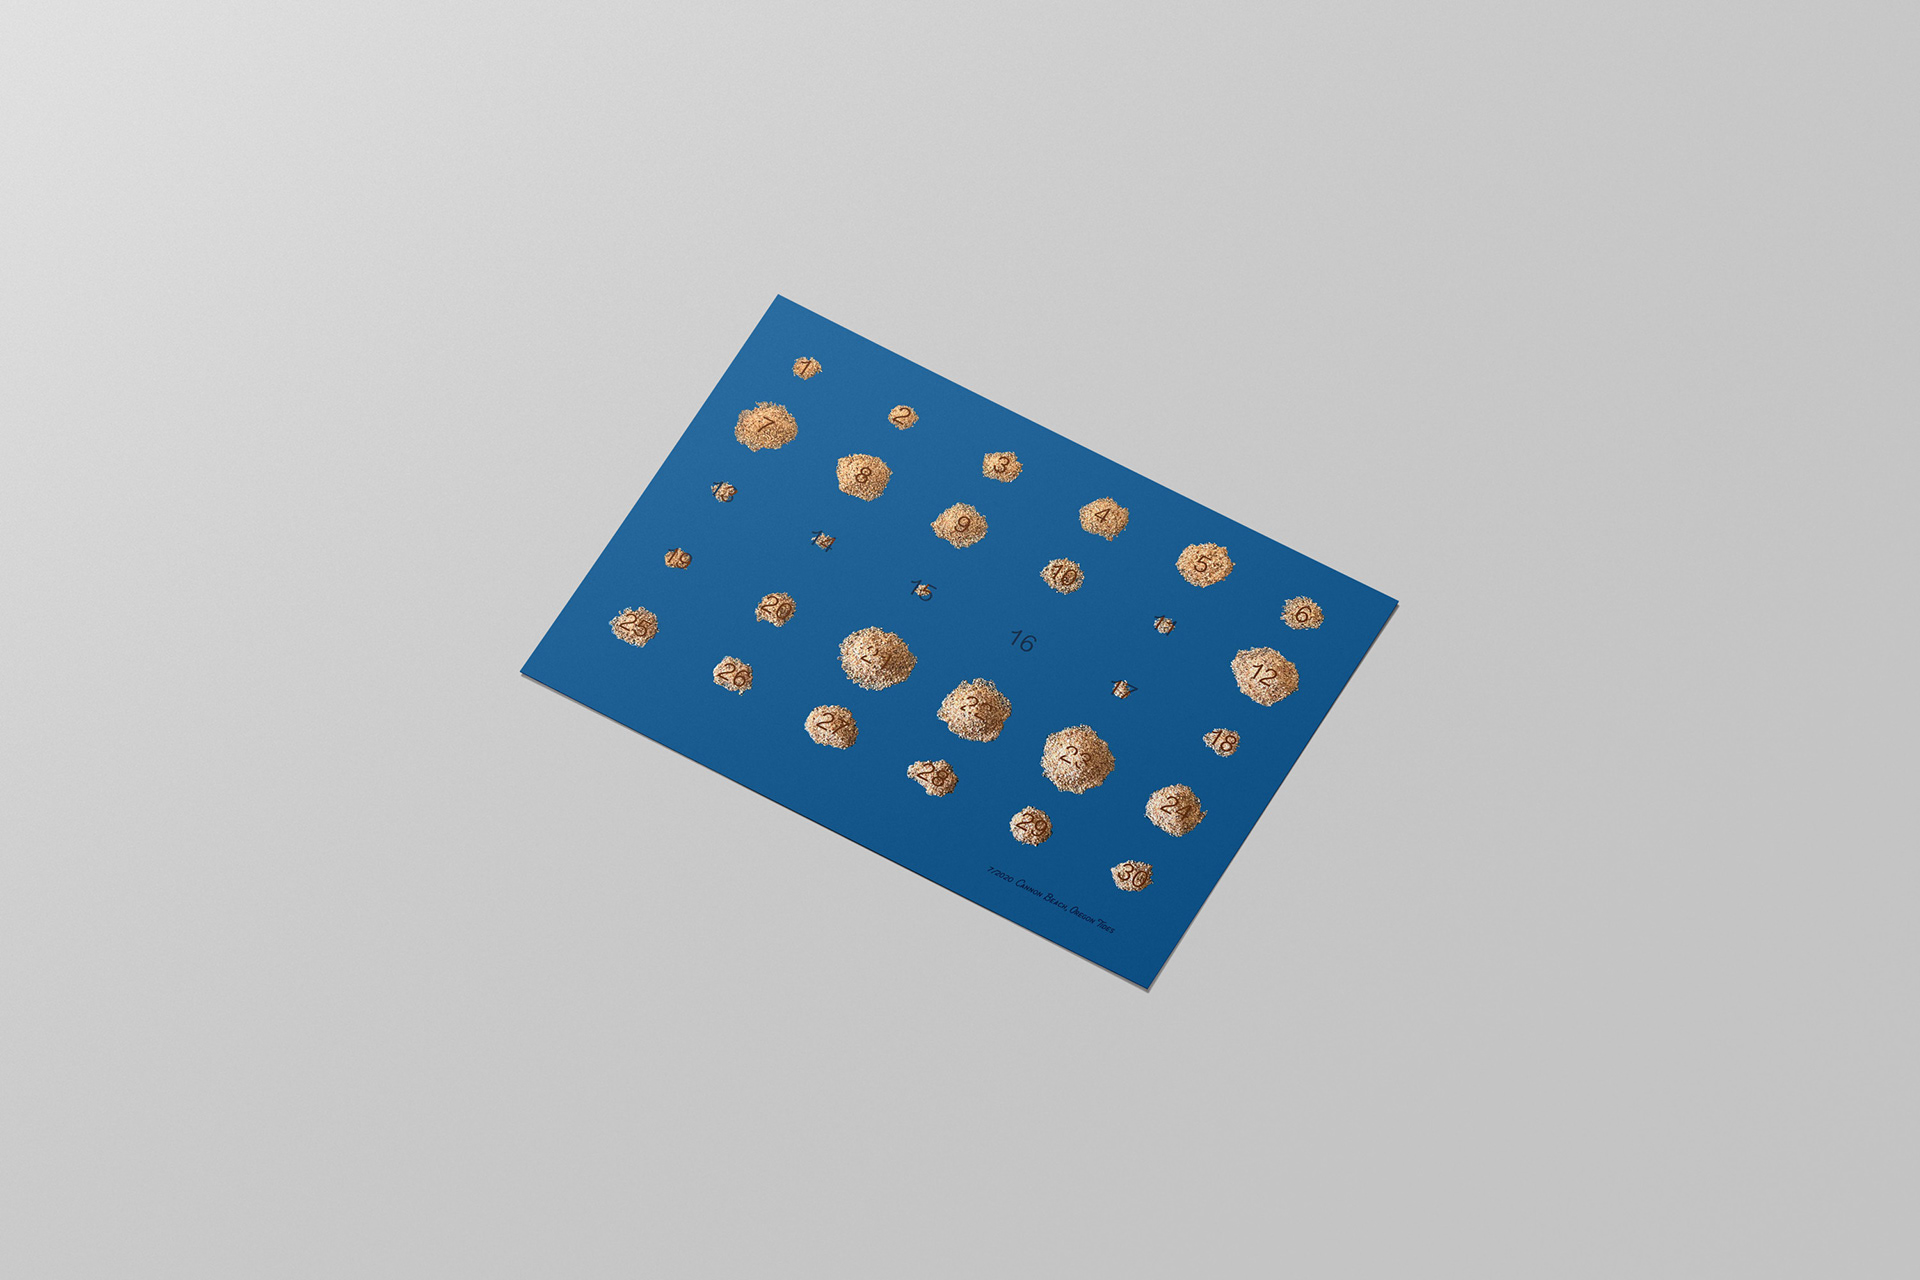
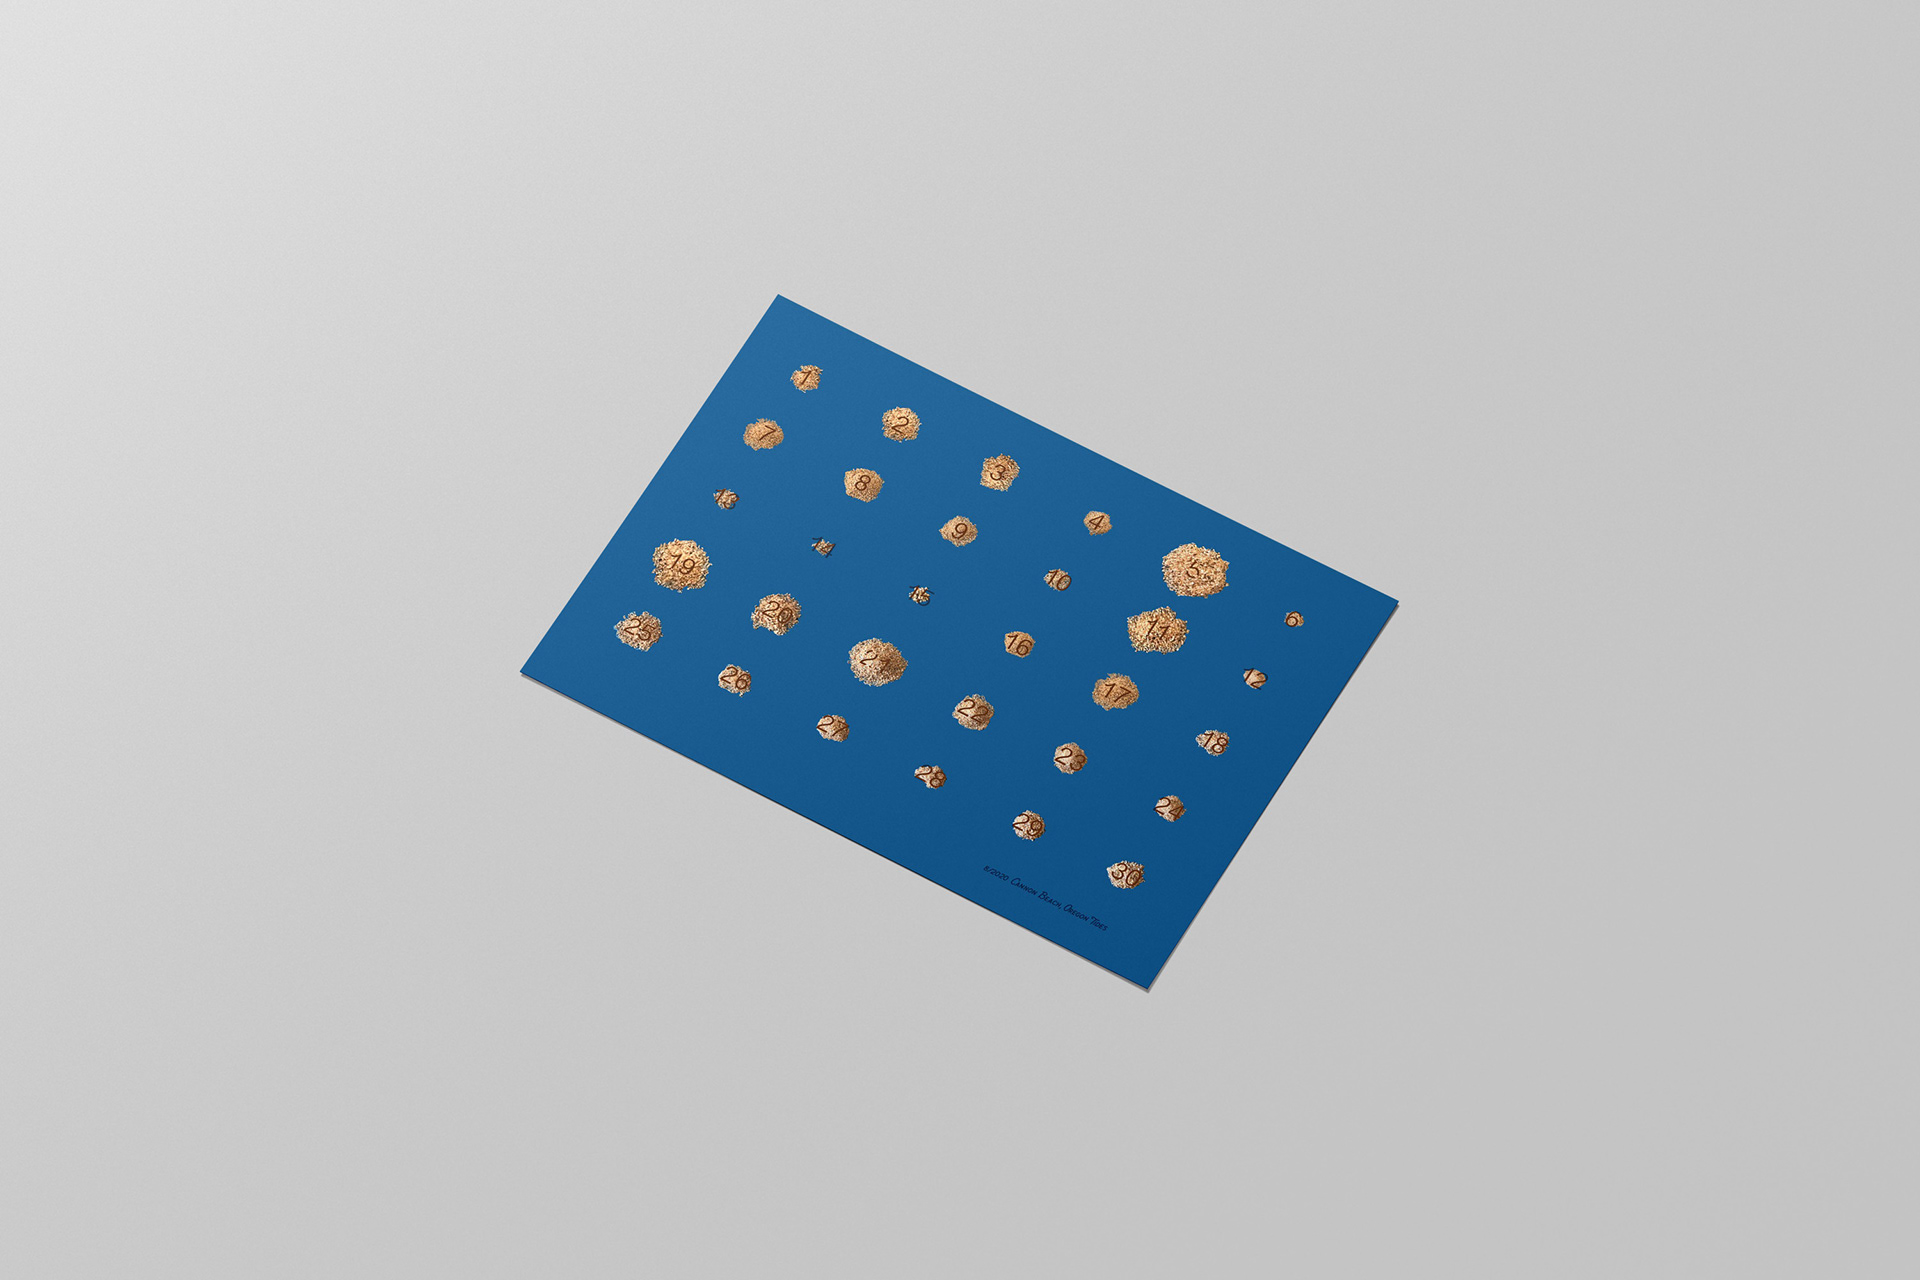
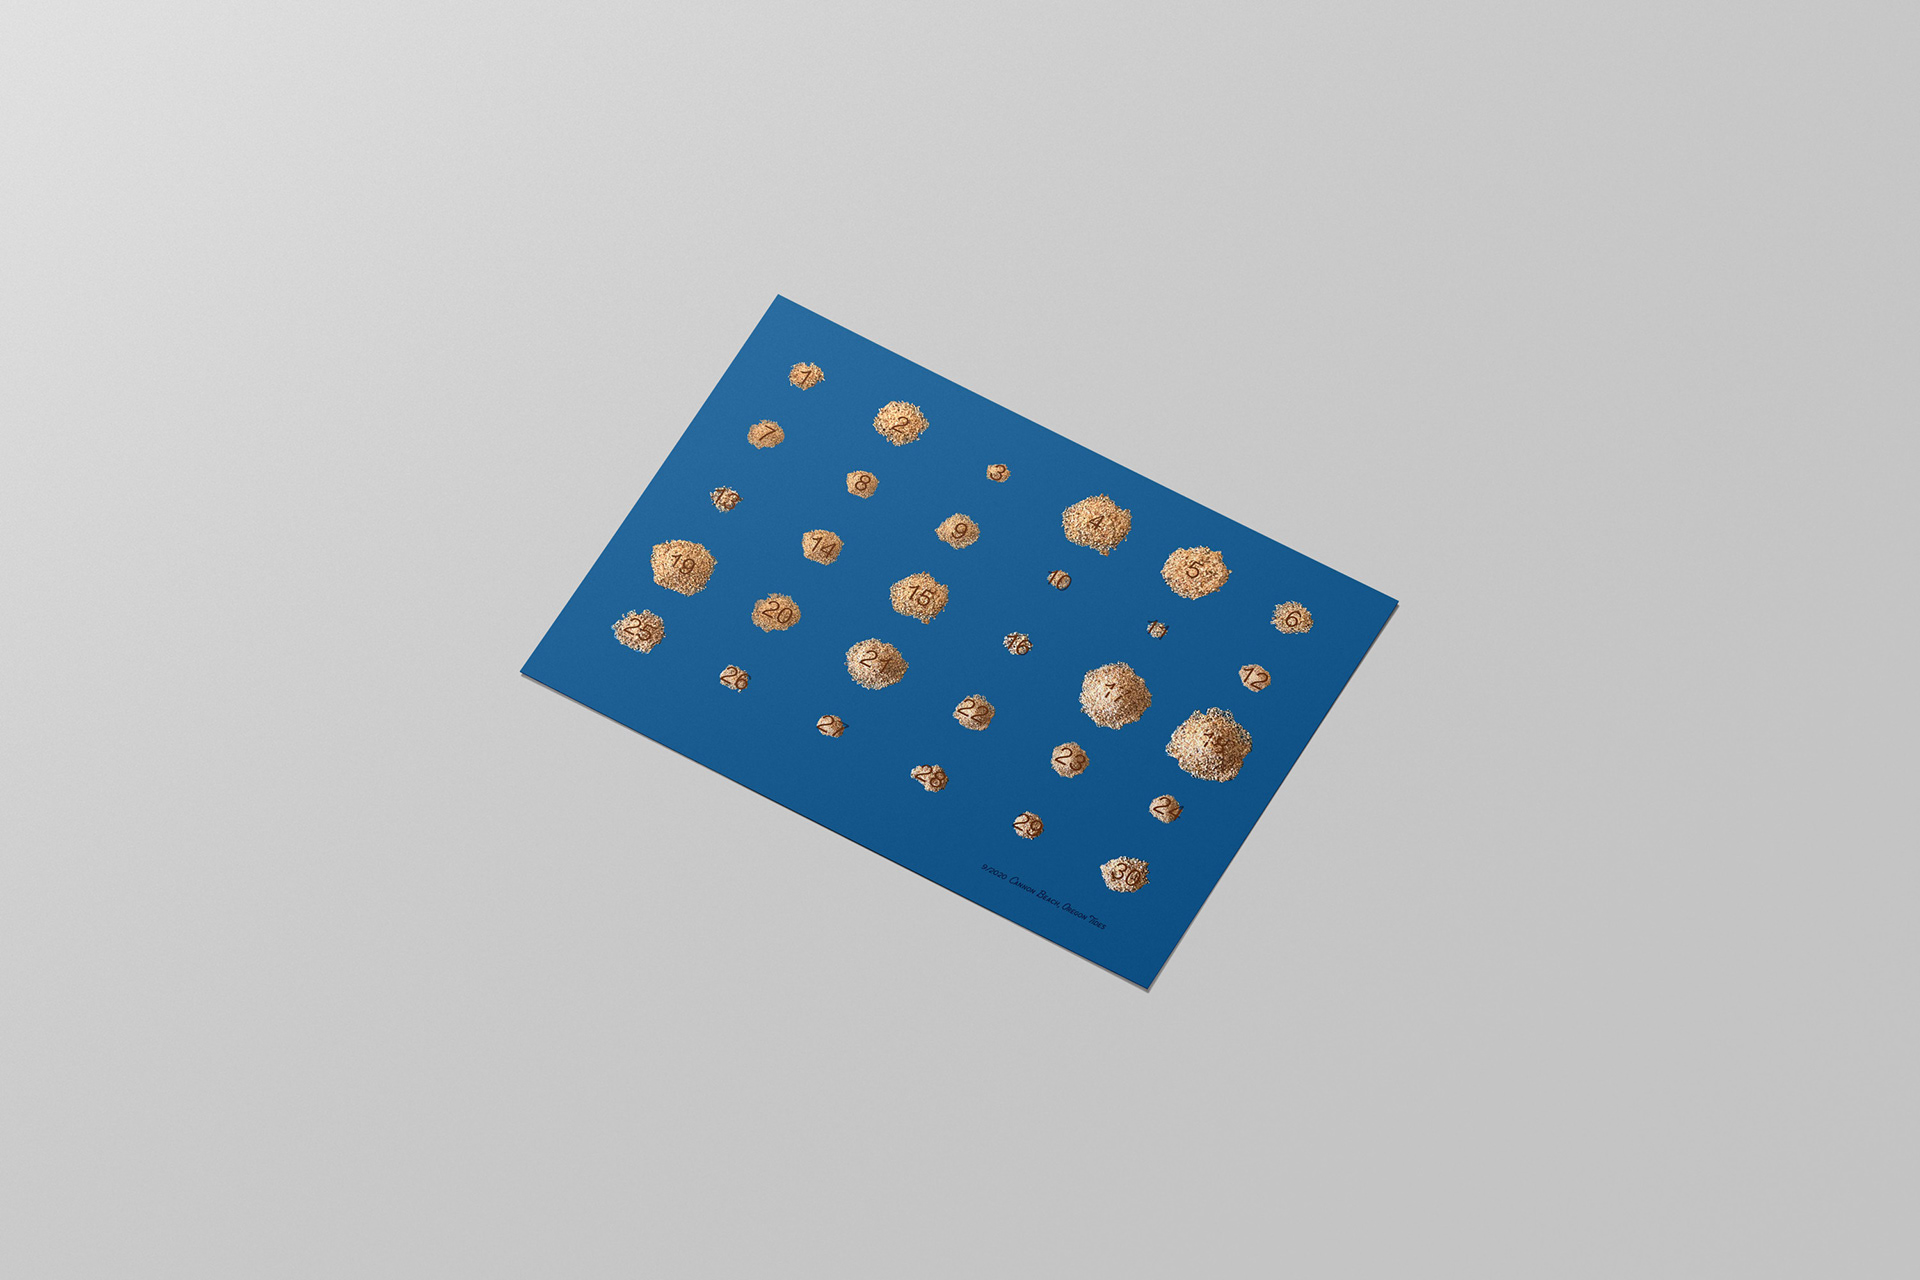
For this project, we chose a topic that spanned over as little as three months to at most three years to track using a calendar. I chose the tide levels over three months in Cannon Beach, Oregon. I wanted to use the page as the water, and the numbers as a visual representation of how much sand on the beach you can see depending on the tides.
FINAL
For example, the less sand you see, the higher the tide. I achieved this effect by collecting sand and taking varying pictures of sand piles. I found this project interesting because you can visually see how the tides change over three months.
